Analysing public transport competitiveness in 6 European cities

The Challenge
Cities struggle to make evidence-based decisions about public transport investments. Traditional mobility surveys cost €600,000+ and take 12-18 months to complete, becoming outdated by the time results are delivered. These surveys typically capture only 3-5% of the population, providing a snapshot in time that cannot measure long-term trends or seasonal variations.
Without reliable, current data, transport planners face inefficient resource allocation, poor modal shift results and political decision-making based on assumptions rather than evidence. Cities cannot effectively identify where public transport loses competitiveness against private cars, nor can they prioritise improvements for maximum impact.
Small and mid-sized cities particularly lack the in-house analytics capability to conduct comprehensive mobility analysis, leaving them dependent on expensive consultant studies that quickly become obsolete.
The Solution
URBANITE project developed a cloud-based mobility intelligence platform using the Public Transport Attractiveness Index (PTAI) methodology. The platform measures public transport competitiveness by calculating the ratio of public transport travel time to car travel time for every origin-destination pair, weighted by actual travel volumes from mobile network data. The concept was tested in six European cities - Bodø, Varberg, Ajka, Tartu, Vitoria-Gasteiz and Bergen.
Key features include:
- Zone-based analysis dividing cities into analysis zones
- Time period variations comparing peak vs off-peak performance
- Colour-coded competitiveness scoring visualisation
- And actionable insights identifying where improvements have highest impact.
The platform integrates GTFS transit data with mobile network data from telecom partners to provide continuous monitoring rather than periodic snapshots. Analysis can be updated quarterly to capture seasonal variations.
Unlike traditional surveys, the platform provides evidence-based planning tools at a fraction of the cost, enabling cities to identify specific corridors and zones where public transport service improvements would attract the most car users to public transport.
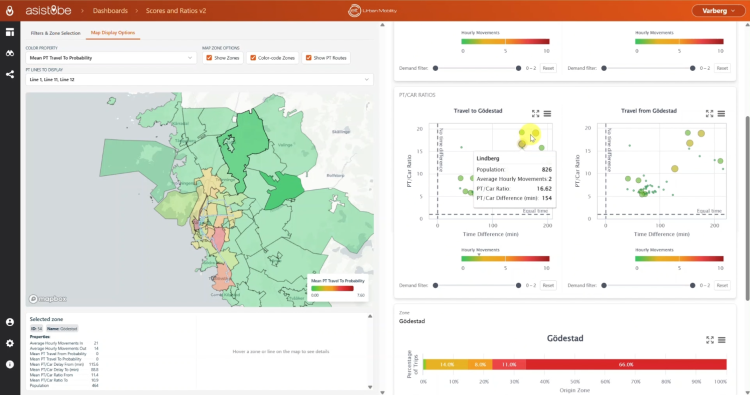
URBANITE Platform: PT Competitiveness Analysis for Varberg, Sweden. The interactive dashboard displays zone-level Public Transport Attractiveness Index (PTAI) scores, showing where public transport competes effectively with car travel (green zones) versus areas needing service improvements (red zones). The PT/Car Ratio scatter plots reveal travel time differentials for each origin-destination pair, enabling transport planners to identify priority corridors for intervention. Selected zone Gödestad shows detailed metrics including population, hourly movements, and trip origin distribution.
Making an impact
Asistobe delivered continuous mobility analysis within weeks, achieving over 90% cost reduction and 95% time savings compared with traditional transport studies. This allowed cities to move from one-time analytical snapshots to quarterly updates, enabling more agile and evidence-based transport planning.
The platform was deployed and validated across six European cities with populations ranging from 30,000 to 280,000 inhabitants and varying levels of data maturity, demonstrating scalability and adaptability to different urban contexts. In Bodø, the platform strengthened the data foundation for the Sustainable Urban Mobility Plan (SUMP) through demand modelling and scenario planning. In Tartu, planners were able to base network modifications on real passenger mobility patterns.
In Ajka, the platform provided data-driven support for a traffic reduction measure on Csokonai Street, demonstrating immediate policy impact potential. In Varberg, it enabled consequence analysis and scenario evaluation to complement strategic planning resources. In Vitoria-Gasteiz, it confirmed the capacity to model and simulate urban transport demand, supporting the development of a more efficient and integrated public transport system.
The project also included 18 engagement workshops across all pilot cities, training municipal transport planning staff on platform use and delivering city-specific mobility analysis reports to each municipality.

Lessons learnt
Data quality validation before deployment is essential: mobile network data providers vary significantly in quality - one vendor's data had to be rejected entirely after ground-truth validation revealed fundamental flaws. Cities often lack expertise to specify data requirements upfront; early validation sessions with local officials proved critical for catching issues before analysis began.
Municipal analytical capacity varies widely: some cities lacked personnel with expertise to interpret platform outputs independently. Successful deployments included structured training workshops and ongoing developer dialogue. Varberg specifically credited "well-functional dialogue with developers" as a key success factor.
The platform works best for strategic rather than micro-level analysis: Tartu noted it suits analysing larger areas and emerging patterns (e.g., new residential developments requiring service extension) rather than tracking movements between small adjacent districts.
Integration with existing municipal planning tools matters: cities expressed strong interest in compatibility with their current GIS and planning systems - standalone tools face adoption barriers regardless of analytical power.
Despite challenges, cities confirmed the core value proposition: continuous mobility intelligence based on actual travel patterns fundamentally improves planning quality compared to assumption-based or outdated survey approaches.