Asistobe Public Transport Attractiveness Index
Cloud-based mobility analytics platform that replaces expensive transport surveys with continuous, data-driven insights into public transport competitiveness - at 90% lower cost.
Supported by: EIT Urban Mobility
Product Details
Asistobe is a cloud-based mobility intelligence platform that transforms how cities plan public transport. By integrating mobile network data with transit schedules, the platform calculates public transport competitiveness against private cars for every origin-destination pair in your city - weighted by actual travel demand, not theoretical models.
Key functionalities:
- Interactive dashboards showing where PT underperforms against cars
- Zone-based analysis with customisable boundaries
- Peak/off-peak and seasonal comparisons
- Priority corridor identification for maximum impact improvements
- Continuous quarterly updates replacing outdated one-time surveys
- Cloud based, scales with your needs
Validated across 6 European cities from 30,000 to 280,000 inhabitants. Onboards any city with standard GTFS data within weeks.
Ready to make evidence-based transport decisions? Click the "Contact us" button for a demonstration using your city's data.

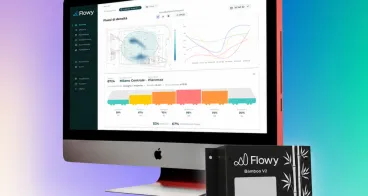
URBANITE Platform: PT Competitiveness Analysis for Varberg, Sweden. The interactive dashboard displays zone-level Public Transport Attractiveness Index (PTAI) scores, showing where public transport competes effectively with car travel (green zones) versus areas needing service improvements (red zones). The PT/Car Ratio scatter plots reveal travel time differentials for each origin-destination pair, enabling transport planners to identify priority corridors for intervention. Selected zone Gödestad shows detailed metrics including population, hourly movements, and trip origin distribution.
URBANITE Platform: PT Competitiveness Analysis for Varberg, Sweden. The interactive dashboard displays zone-level Public Transport Attractiveness Index (PTAI) scores, showing where public transport competes effectively with car travel (green zones) versus areas needing service improvements (red zones). The PT/Car Ratio scatter plots reveal travel time differentials for each origin-destination pair, enabling transport planners to identify priority corridors for intervention. Selected zone Gödestad shows detailed metrics including population, hourly movements, and trip origin distribution.
Best Practices

Analysing public transport competitiveness in 6 European cities
Availability
Discover cities and markets where the product is available